


Gene regulation & networks in bacteria & archaea
There is scarce information in peer-reviewed scientific articles in regards to the constitution of a minimal gene regulatory network of a supposed last universal common ancestor. All we can do is give a closer look at the architecture of bacterial gene regulation which is simpler than eukaryotic gene regulation, to have a glimpse of what is necessary, and what players are in charge, and would have had to emerge to be part of a LUCA. For that, we will rely on articles from model bacteria, like E.Coli, Bacillus subtilis, and others. L. Aravind (2009): Genetic and molecular studies have deciphered the regulatory processes for a significant fraction of the E.Coli genome. 7
The regulation of genes is essential and performed in all life forms. Genes have to be encountered fast and with precision by the cell's machinery. It is often mentioned that genes are analogous to blueprints. A better comparison might be to compare them to books in a library. Each book contains instructions to make a specific molecular machine, or how to operate the cell. The gene regulatory network compares to library software, to find books on the shelf. The regulatory circuitry controls how the cell has to operate, and how to respond and adapt to the surrounding environmental conditions. It activates transcription and represses it when needed, and is responsible for forming phenotypes that best adapt to the surrounding environmental conditions. It controls DNA replication, the partition of nascent chromosomes to form daughter cells, and the repair of DNA, among other essential tasks. Obviously, these functions had to be fully functional when life started, since they are indispensable.
Systems Biology page 189 (2016): The expression of genes is a highly regulated process in prokaryotic cells and has a profound impact on the ability of the cells to maintain vitality, perform cell division, and respond to environmental changes or stimuli. There are two basic mechanisms of gene expression regulation: the transcriptional regulation through transcription factors (TFs) that bind to DNA motifs upstream of the transcription start site and thus initiate transcription of the DNA sequence to mRNA, and the posttranscriptional regulation through microRNAs (miRNAs) that bind to the mRNA sequences and act as translational repressors. 11
Gene regulatory networks GRNs consist of transcription factors (TFs) and the cis-regulatory modules (CRMs, e.g. “enhancers” [ In genetics, cis refers to linked markers and trans to separated markers.] ) that control Spatio-temporal patterns of gene expression. For a GRN to be understood as a network, both edges (TFs) and nodes (CRMs) must be defined 1
Lesley T. MacNeil (2011): In any given cell, thousands of genes are expressed and work in concert to ensure the cell's function, fitness, and survival. Each gene, in turn, must be expressed at the proper time and in the proper amounts to ensure the appropriate functional outcome. The regulation and expression of some genes are highly robust; their expression is controlled by invariable expression programs. The characterization of GRNs has uncovered global principles of gene regulation. 2
J.A.Freyre-Gonzalez (2014): Gene regulatory networks are not randomly organized but follow well-defined organizational principles, that are modular. Modules are defined as a group of genes cooperating to achieve a particular physiological function. There are principles governing the systems-level coordination and integration of molecular responses to environmental cues.
Rekins Janky (2013): An estimated one billion bacterial species occupy virtually all ecological niches on our planet. Bacteria show in particular a high capacity of adaptation to environmental changes and extreme conditions such as high temperature, high atmospheric or osmotic pressure, and pH. This adaptive behavior suggests that various responses need different levels of regulation from signal reception to gene expression. Gene expression is controlled at multiple levels:
i) transcriptional level which can be regulated at the initiation and the termination steps,
ii) translational level where codon usage bias can optimize the translation,
iii) and posttranslational modifications such as phosphorylation and methylation of the protein.
At the level of the transcription initiation, a protein called Transcription factor (TF) binds to the promoter region of the gene, activating or repressing its expression. The DNA signal where the TF binds is called a Transcription Factor Binding Site (TFBS) and is characterized by its sequence and its position. TFBS are also known as cis-acting regulatory elements where cis refers to the fact that the transcription factor binds to the same DNA molecule as the one on which the regulated gene resides. On the contrary, TF is a trans-acting element as it is coming from a different molecule than the target gene. Sigma factors and RNA polymerase (RNAP) are other trans actors that play an important role in transcriptional regulation.
Responding to Particular Physiological Signals
What is a signal? Physiological signals sense the presence or absence of small molecules (e.g., nutrients, salts, and molecular species) or physicochemical states (e.g., temperature, redox potential, and osmolarity). How do signals control the activation of regulatory molecules? The signal induces a steric change in the regulatory molecule, thus activating or inactivating it, through a mechanism known as allosterism. In fact, regulators exhibit a dual (authoritative/dependent) behavior because they can both 1. play an authoritative role in activating or repressing certain genes and 2. depend on environmental cues to be activated or inactivated via allosterism. However, the effect level varies according the signal input. For example, in E. coli, Salmonella typhimurium, and some bacilli, low concentrations of oxygen function as a stimulus for aerotaxis (chemotaxis to oxygen), whereas high concentrations work as a signal to activate aerobic respiration. Meanwhile, very high oxygen concentrations impose an oxidative stress on bacteria, thus activating specialized systems to cope with stress. If the stress-adaptation systems fail or the oxygen levels continue to increase, then the cell will cross a point of no return, known in material sciences as the "destruction point," and it eventually dies.
The Four Functional Units of Regulation
How can gene expression be organized by the gene's response to environmental signals? Genes that respond to specific signals are grouped into operons and regulons, which are the first two levels of genetic organization. However, certain complex processes (e.g., flagellar assembly and sporulation) require coordinated expression over time, which cannot occur without a complex regulatory circuit. Therefore, operons and regulons must be embedded into a complex structure called the module that is responsible for well-defined physiological functions. Together, operons, regulons, and modules form a hierarchy (operon < regulon < module) that governs genetic organization. Are there parallels between the definitions of operon, regulon, and module? Certainly, in general terms, both operons and regulons themselves are kinds of modules. This similarity reflects the self-similar nature of genetic organization, in which some modules are nested inside other modules like a set of Russian nesting dolls, or matryoshka.
With these ideas in mind, scientists designed a way to analyze and reveal the complex interrelationships (architecture) of the functional components shaping regulatory networks. The approach is a form of analysis called "natural decomposition," which refers to the different functional components that are dissected, identified, and classified according to biologically pertinent premises and rules. These scientists based the natural decomposition approach on two biologically relevant premises: (1) A module is a set of genes cooperating to perform a particular physiological function, and (2) given their multiple (pleiotropic) effects, global regulators should not belong to modules, but rather coordinate them in response to general environmental cues. They studied the E. coli regulatory network and identified four key functional components by which to organize the regulatory network: global transcription factors, strictly globally regulated genes, modular genes, and intermodular genes. They chose these functional components because they play important roles in the coordination and integration of physiological responses in a cell.
An analogy between a cell and human business operation can be helpful when conceptualizing the roles of functional components. Cell regulation can be seen as a decision-making process with the following main characteristics. One characteristic is that global transcription factors are analogous to general managers responsible for coordinating specialized cell functions by using wide-scope directives (signals). Another characteristic is that strictly globally regulated genes are cross-functional teams of genes that only respond to broad, nonspecific directives (signals). A third characteristic is that modular genes are composed of departments (modules) devoted to particular cell functions. And the fourth characteristic is that intermodular genes are specialized task forces that integrate directives (signals) coming from different departments (modules) to achieve an integrated response. The organizational chart of a company or a business commonly resembles a pyramid, where a few elements in each layer of the pyramid control a greater number of elements in the layers below. Given this property of hierarchies, feedback is uncommon. All these functional components in cells form a nonpyramidal, matryoshka-like hierarchy that exhibits feedback (Figure 3).

Functional architecture of E. coli genetics as revealed by the natural decomposition approach.
Red-labeled nodes represent global transcription factors. Genes composing modules were shrunk into a single colored node. Black arrows indicate regulatory interactions between global transcription factors. Red rounded-corner rectangles bound hierarchical layers. For the sake of clarity, RpoD (the housekeeping sigma factor) interactions are not shown, and the single yellow node at the bottom represents the megamodule whose submodules are held together only by intermodular genes. This analysis revealed that the functional architecture hierarchy exhibits feedback from well-defined independent modules devoted to particular cellular functions. The functions are globally coordinated by global transcription factors, and the disparate responses are integrated by intermodular genes.
Coordinating Responses to General Signals
How are modules coordinated? Global transcription factors are akin to general managers. They are responsible for coordinating the cell's functional departments (modules) in terms of a common goal and general signals, such as the presence or absence of its main carbon source or various stresses. A global transcription factor is one that 1. regulates many genes, 2. regulates genes that participate in more than one metabolic pathway, and 3. coordinates the expression of gene groups in response to common needs. In addition, scientists have defined two important concepts to study networks: the degree of a node and its clustering coefficient. If we think of nodes in social terms, the degree of a node would tell us how many friends you have, whereas the clustering coefficient gives information about how many of your friends know each other. In different complex networks, ranging from the Internet to molecular networks, scientists have observed that there is an inverse relationship between the degree of the node and its clustering coefficient.
This relationship gives rise to an interesting behavior. Although a few nodes have a high degree (hubs with a lot of spokes, or popular people) and a low clustering coefficient (low probability of belonging to a module, or community), many other nodes have the opposite: a low connectivity and a high clustering coefficient. What kind of conclusions could be drawn from these data? Inspired by these definitions and results, Freyre-González and his colleagues reached two conclusions. The first is that given that global transcription factors regulate many genes, they are hubs, and because they exhibit a high degree, they are not modules, but they coordinate them. Their second conclusion was that nonhub nodes must be modules because they show a high clustering coefficient. Therefore, these scientists proposed that the removal of the global transcription factors would naturally reveal the functional modules. They described an objective mathematical principle, called the k-value, to identify the global transcription factors. This principle is based on the previously mentioned observation that the degree of a node and its clustering coefficient show an inverse relationship. They discovered that it is possible to find an equilibrium point where the change in degree equals the change in clustering coefficient. This equilibrium point separates the nodes with high degrees and low clustering coefficients (the global transcription factors) from the nodes with low degrees and high clustering coefficients (the modular genes). All the E. coli global transcription factors are involved in the response to general signals (e.g., energy levels, redox potential, stress by heat shock, general stresses, and nitrogen metabolism) (Figure above).
Some genes respond to both specific and general signals. Nevertheless, other gene products are so ubiquitous and important that their expression is only governed by general signals. These strictly globally regulated genes comprise elements for the basal machinery of the cell (e.g., tRNAs and their charging enzymes, DNA and RNA polymerases, ribosomal elements, key enzymes of the tricarboxylic acid cycle and respiratory chain, and DNA methylation enzymes).
Integrating Disparate Physiological Responses
After removing the global transcription factors, Freyre-González and his colleagues observed sixty-two modules and a megamodule. What elements held this megamodule together? Their evidence suggested that the megamodule was held together by non-transcription-factor-encoding genes. Therefore, they defined an intermodular gene as a structural non-transcription-factor-encoding gene whose expression is governed by transcription factors belonging to two or more modules. This megamodule comprises thirty-nine submodules, which were held together by intermodular genes. The intermodular genes integrate disparate physiological responses at the promoter level.
Bacterial gene expression is based on complex coordination and integration of multiple environmental cues. Four components shape the functional architecture of bacterial regulatory networks: 1. global transcription factors, which are responsible for responding to general signals and for module coordination; 2. strict, globally regulated genes, which are responsible for encoding products important for the basal machinery of the cell and are only governed by global transcription factors; 3. modular genes, which are modules devoted to particular cell functions; and 4. intermodular genes, which are responsible for integrating, at the promoter level, disparate physiological responses coming from different modules to achieve an integrated response. All these functional components form a nonpyramidal, matryoshka-like hierarchy exhibiting feedback. In this functional architecture, well-defined independent modules are globally coordinated by global transcription factors, whose disparate physiological responses are integrated, at the promoter level, by intermodular genes. 3
Liu Tian et al., (2022): A transcriptional regulatory network (TRN) is composed of the regulatory relationships between transcription factors (TF) and their target genes which serves as the information processing hub to respond to intracellular and environmental signals. The regulatory relationships in TRN could be positive (activation) or negative (repression) or both (conditionally activation or repression) and the whole TRN is usually scale-free with small numbers of highly connected nodes. Since TRN is a directed graph, it is usually organized in a hierarchical structure and genes of different levels in the hierarchy usually bear different functions; a hierarchical structure makes TRN more robust. There are building blocks in TRN called network motifs which are connected subgraphs that appear more frequently in real networks than in the corresponding randomized networks. Typical network motifs in TRN are negative autoregulation, feed-forward loop (FFL) and single input module (SIM). The specific topologies of these network motifs give them unique dynamic functions; for example, FFLs have the function of filtering noisy signals and speeding up responses, while SIMs can switch ON/OFF multiple target genes in a temporal sequential order, often acting as a timer during biological development. In TRN, various network motifs are intertwined to produce rich kinetic functions, which jointly regulate the growth and development of an organism.
Chromatin interaction in the hierarchy of TRN
According to the network topology, TRNs can be divided into four layers: Top, Middle, Bottom and Target. Except for the Target layer, the genes in the other three layers are transcription factors. In the Top, Middle and Bottom layers, there are 8, 75, 131 genes for E. coli and 6, 38, 148 genes for B. subtilis, respectively, and the two bacterial TRNs show a pyramidal hierarchy. We examined the regulatory relationships within and between the layers and found that the majority of the Target layer genes in E. coli and B. subtilis are directly regulated by the Middle layer genes and that the regulations intra the Middle layer are also dense. In contrast, the Bottom layer, even if the number of genes in this layer is more than the Middle layer, has less intra regulations. There are many self-regulating edges (76/89 in E. coli and 76/86 in B. subtilis) in the Bottom layer and much fewer self-regulating edges (53/335 in E. coli and 24/127 in B. subtilis) in the Middle layer. It is evident that the Middle layer is the information processing and transmission hub which can make complex decisions. As a mediator level, the Bottom layer plays a cascading role to enrich the regulation forms of Target genes. The chromatin interaction frequencies within and between hierarchical levels are compared to the chromatin interaction frequency of TRN. Interestingly, the spatial organization of the Middle-Bottom-Target hierarchical structure shows a high degree of stability in all culture conditions of E. coli and B. subtilis: the chromatin interaction frequencies intra the Middle layer (Middle-Middle) and intra the Bottom layer (Bottom-Bottom) and between the Bottom-Target layers are significantly higher than that of the TRN; the chromatin interaction frequencies between Middle-Bottom layers and between MiddleTarget layers are significantly lower than that of the TRN; others are of no significant difference compared with TRN.
L. Aravind (2009): Scientific studies have unraveled the general or basal transcription factors (such as sigma factors) and specific transcription factors (such as the lac operon repressor, lacI) that together mediate the expression of target genes by binding specific regulatory DNA sequences called transcription factor binding sites:

Fig.2 The transcription apparatus and transcription regulatory network of bacteria.
(a) Schematic representation of the architecture of bacterial transcription machinery and operons and regulons. A regulon is a set of genes regulated by one transcription factor; an operon is a set of adjacent genes transcribed into one mRNA.
(b) Architecture of transcription regulatory networks. The global structure (left) and three types of motifs found in transcription regulatory networks (right) are depicted as ordered graphs. Red dots indicate transcription factors; blue dots indicate targets. (c) The degree distribution of transcription factor-target interactions is approximated by a power-law equation. The graph shows a power-law distribution; degree (d) is the number of regulatory connections between a transcription factor and target genes, while P(d) indicates the probability of transcription factors with a particular number of such connections. Pol, polymerase; TF, transcription factor; TFBS, transcription factor binding site. 7
Power-law equation
Albert-László Barabási (2004): Various types of interaction webs, or networks, (including protein-protein interaction, metabolic, signaling and transcription-regulatory networks) emerge from the sum of these interactions. None of these networks are independent, instead, they form a ‘network of networks that is responsible for the behavior of the cell. the architectural features of molecular interaction networks within a cell are shared to a large degree by other complex systems, such as the Internet, computer chips, and society. This unexpected universality indicates that similar laws may govern most complex networks in nature, which allows the expertise from large and well-mapped non-biological systems to be used to characterize the intricately interwoven relationships that govern cellular functions. t the quantifiable tools of network theory offer unforeseen possibilities to understand the cell’s internal organization and evolution, fundamentally altering our view of cell biology. The emerging results are forcing the realization that, notwithstanding the importance of individual molecules, cellular function is a contextual attribute of strict and quantifiable patterns of interactions between the myriad of cellular constituents. Although uncovering the generic organizing principles of cellular networks is fundamental to our understanding of the cell as a system, it also needs to develop relevance for the experimental biologist, helping to elucidate the role of individual molecules in various cellular processes.
Architectural features of cellular networks
Probably the most important discovery of network theory was the realization that despite the remarkable diversity of networks in nature, their architecture is governed by a few simple principles that are common to most networks of major scientific and technological interest. For decades graph theory — the field of mathematics that deals with the mathematical foundations of networks — modeled complex networks either as regular objects, such as a square or a diamond lattice, or as completely random network. This approach was rooted in the influential work of two mathematicians, Paul Erdös, and Alfréd Rényi, who in 1960 initiated the study of the mathematical properties of random networks. Their much-investigated random network model assumes that a fixed number of nodes are connected randomly to each other (image below).

The most remarkable property of the model is its ‘democratic’ or uniform character, characterizing the degree, or connectivity, of the individual nodes. Because, in the model, the links are placed randomly among the nodes, it is expected that some nodes collect only a few links whereas others collect many more. In a random network, the nodes degrees follow a Poisson distribution, which indicates that most nodes have roughly the same number of links, approximately equal to the network’s average degree, (where <> denotes the average); nodes that have significantly more or fewer links than are absent or very rare (BOX 2). Despite its elegance, a series of recent findings indicate that the random network model cannot explain the topological properties of real networks. The deviations from the random model have several key signatures, the most striking being the finding that, in contrast to the Poisson degree distribution, for many social and technological networks the number of nodes with a given degree follows a power law. That is, the probability that a chosen node has exactly k links follows P(k) ~ k –γ , where γ is the degree exponent, with its value for most networks being between 2 and 3. Networks that are characterized by a power-law degree distribution are highly non-uniform, most of the nodes have only a few links. A few nodes with a very large number of links, which are often called hubs, hold these nodes together. Networks with a power degree distribution are called scale-free, a name that is rooted in statistical physics literature. It indicates the absence of a typical node in the network (one that could be used to characterize the rest of the nodes). This is in strong contrast to random networks, for which the degree of all nodes is in the vicinity of the average degree, which could be considered typical. However, scale-free networks could easily be called scale-rich as well, as their main feature is the coexistence of nodes of widely different degrees (scales), from nodes with one or two links to major hubs.
Cellular networks are scale-free.
An important development in our understanding of the cellular network architecture was the finding that most networks within the cell approximate a scale-free topology. The first evidence came from the analysis of metabolism, in which the nodes are metabolites and the links represent enzyme-catalyzed biochemical reactions.

Characterizing metabolic networks.
To study the network characteristics of the metabolism a graph theoretic description needs to be established. Here, the graph theoretic description for a simple pathway (catalysed by Mg2+-dependant enzymes) is illustrated (a). In the most abstract approach (b) all interacting metabolites are considered equally. The links between nodes represent reactions that interconvert one substrate into another. For many biological applications it is useful to ignore co-factors, such as the high-energy-phosphate donor ATP, which results in a second type of mapping (c) that connects only the main source metabolites to the main products. d | The degree distribution, P(k) of the metabolic network illustrates its scale-free topology. e | The scaling of the clustering coefficient C(k) with the degree k illustrates the hierarchical architecture of metabolism (The data shown in d and e represent an average over 43 organisms). f | The flux distribution in the central metabolism of Escherichia coli follows a power law, which indicates that most reactions have small metabolic flux, whereas a few reactions, with high fluxes, carry most of the metabolic activity. It should be noted that on all three plots the axis is logarithmic and a straight line on such log-log plots indicates a power-law scaling. CTP, cytidine triphosphate; GLC, aldo-hexose glucose; UDP, uridine diphosphate; UMP, uridine monophosphate; UTP, uridine triphosphate.
As many of the reactions are irreversible, metabolic networks are directed. So, for each metabolite, an ‘in’ and an ‘out’ degree can be assigned that denotes the number of reactions that produce or consume it, respectively. The analysis of the metabolic networks of 43 different organisms from all three domains of life (eukaryotes, bacteria, and archaea) indicates that the cellular metabolism has a scale-free topology, in which most metabolic substrates participate in only one or two reactions, but a few, such as pyruvate or coenzyme A, participate in dozens and function as metabolic hubs. As for direct physical interactions, protein-protein interactions in diverse eukaryotic species also have the features of a scale-free network. Examples of scale-free organization include genetic regulatory networks, in which the nodes are individual genes and the links are derived from protein domain networks that are constructed on the basis of protein domain interactions. However, not all networks within the cell are scale-free. For example, the transcription regulatory networks of S. cerevisiae and Escherichia coli offer an interesting example of mixed scale-free and exponential characteristics. Indeed, the distribution that captures how many different genes a transcription factor interacts with follows a power law, which is a signature of a scale-free network. This indicates that most transcription factors regulate only a few genes, but a few general transcription factors interact with many genes. However, the incoming degree distribution, which tells us how many different transcription factors interact with a given gene, is best approximated by an exponential, which indicates that most genes are regulated by one to three transcription factors. So, the key message is the recognition that cellular networks have a disproportionate number of highly connected nodes. Although the mathematical definition of a scale-free network requires us to establish that the degree distribution follows a power law, which is difficult in networks with too few nodes, the presence of hubs seems to be a general feature of all cellular networks, from regulatory webs to the p53 module. These hubs fundamentally determine the network’s behavior.
Small-world effect and assortativity: A common feature of all complex networks is that any two nodes can be connected with a path of a few links only. This ‘small-world effect’, which was originally observed in a social study, has been subsequently shown in several systems, from neural networks to the World Wide Web. Although the small-world effect is a property of random networks, scale-free networks are ultra-small — their path length is much shorter than predicted by the small-world effect. Within the cell, this ultra-small-world effect was first documented for metabolism, where paths of only three to four reactions can link most pairs of metabolites. This short path length indicates that local perturbations in metabolite concentrations could reach the whole network very quickly. Interestingly, the reduced metabolic network of a parasitic bacterium has the same mean path length as the highly developed network of a large multi-cellular organism, which indicates that there are mechanisms that implemented the maintenance of the average path length during evolution.
Motifs, modules, and hierarchical networks
Cellular functions are likely to be carried out in a highly modular manner. In general, modularity refers to a group of physically or functionally linked molecules (nodes) that work together to achieve a (relatively) distinct function. Modules are seen in many systems, for example, circles of friends in social networks or websites that are devoted to similar topics on the World Wide Web. Similarly, in many complex engineered systems, from a modern aircraft to a computer chip, a highly modular structure is a fundamental design attribute. Biology is full of examples of modularity. Relatively invariant protein-protein and protein–RNA complexes (physical modules) are at the core of many basic biological functions, from nucleic-acid synthesis to protein degradation. Similarly, temporally coregulated groups of molecules are known to govern various stages of the cell cycle, or to convey extracellular signals in bacterial chemotaxis or the yeast pheromone response pathway. In fact, most molecules in a cell are either part of an intracellular complex with modular activity, such as the ribosome, or they participate in an extended (functional) module as a temporally regulated element of a relatively distinct process (for example, signal amplification in a signaling pathway).
The biochemical activity in both the metabolic and genetic networks is dominated by several ‘hot links’ that represent high activity interactions that are embedded into a web of less active interactions. This attribute does not seem to be a unique feature of biological systems: there are hot links in many non-biological networks, their activity following a wide distribution. The origin of this seemingly universal property of the links is probably rooted again in the network topology. Indeed, it seems that the metabolic fluxes and the weights of links in some non-biological systems are uniquely determined by the scale-free nature of the network topology. At present, a more general principle that could explain the coexpression distribution data equally well is lacking. It is impossible to ignore the apparent universality we have witnessed by delving into the totality of pairwise interactions among the various molecules of a cell. Instead of chance and randomness, we have found a high degree of internal order that governs the cell’s molecular organization. Along the way, a new language has been created, which allows the cell’s molecular makeup to be discussed as a network of interacting constituents, and to spot and quantify the interplay between behavior, structure, and function. The cell can be approached from the bottom up, moving from molecules to motifs and modules, or from the top to the bottom, starting from the network’s scale-free and hierarchical nature and moving to the organism-specific modules and molecules. In either case, it must be acknowledged that structure, topology, network usage, robustness, and function are deeply interlinked, forcing us to complement the ‘local’ molecule-based research with integrated approaches that address the properties of the cell as a whole. 8
Michael E. Wall (2004): Early studies of gene regulation began with a small number of bacterial systems and led to the celebrated operon model of Jacob and Monod, which introduced concepts such as OPERON, regulator gene and transcriptional repression. This model was elaborated extensively as different regulatory mechanisms, such as transcriptional activation, were discovered. Today, hundreds to thousands of diverse GENETIC REGULATORY CIRCUITS, mostly in bacteria, have, to some extent, been characterized experimentally. This wealth of knowledge, which is complemented by the availability of many genome sequences, has motivated us to identify clear patterns in the DESIGN of these circuits and to search for DESIGN PRINCIPLES that can explain their natural diversity. The impressive body of data already available, and the types of data being generated or contemplated at present, allows a comprehensive global understanding of gene regulation that cannot be obtained through the study of any individual system. Theoretical studies of gene regulation have elucidated design principles for transcriptional regulation of bacterial transcription factors (TFs) in ELEMENTARY GENE CIRCUITS. 9
Agustino Martinez-Antonio (2003): Transcription factors (TFs) have been described as ‘two-headed molecules’ consisting of a DNA-binding site and an allosteric–metabolite interaction. Metabolites or covalent modifications link the sensing of extracellular stimuli with intracellular stimuli in the switch governing the expression or repression of genes, operons and regulons. The relationship between sensing stimuli and deciding a pattern of expression involves the interplay of transporters, signal transduction mechanisms, thresholds of interactions, together with the organization of genes into operons, regulons and stimulons, and the control of chromosome structure. 4
L. Aravind (2009): The transcription regulatory network provides a powerful theoretical framework to analyze the complete regulatory system of model organisms such as E.coli or B.subtilis. Topological studies on such networks have revealed fundamental features that are common to other biological and non-biological networks, such as an approximation of the power-law degree distribution of regulatory interactions (few transcription factors regulate many genes, and most transcription factors regulate a low number of genes) and the presence of certain stereotypical recurring patterns of connections called motifs (Figure 2b,c). These features are important for deciphering the responses of organisms to the environment, as well as for biochemical engineering of pathways. Prokaryotic gene regulation typically takes place through certain conserved specific transcription factors operating on operons or regulons of genes, whose products are involved in well-defined cellular processes (Figure 2a). Usually, these transcription factors come with a distinctive sensor domain, in addition to their DNA-binding domain, that helps them respond to the particular effector compound that induces their target regulons. These observations led to the most straightforward computational approach for reconstruction of transcription regulatory networks in uncharacterized organisms: identifying orthologs of transcription factors and target genes with respect to a template network in a model organism (such as E. coli) and transferring the regulatory connections to the organism of interest by assuming co-conservation of such transcription factor-target pairs (Figure 2a). An alternative approach assumes the conservation of transcription factor binding sites across distantly related prokaryotes and predicts target genes for conserved transcription factors using position-specific weight matrices or hidden Markov models derived from binding site alignments (Figure 2b).
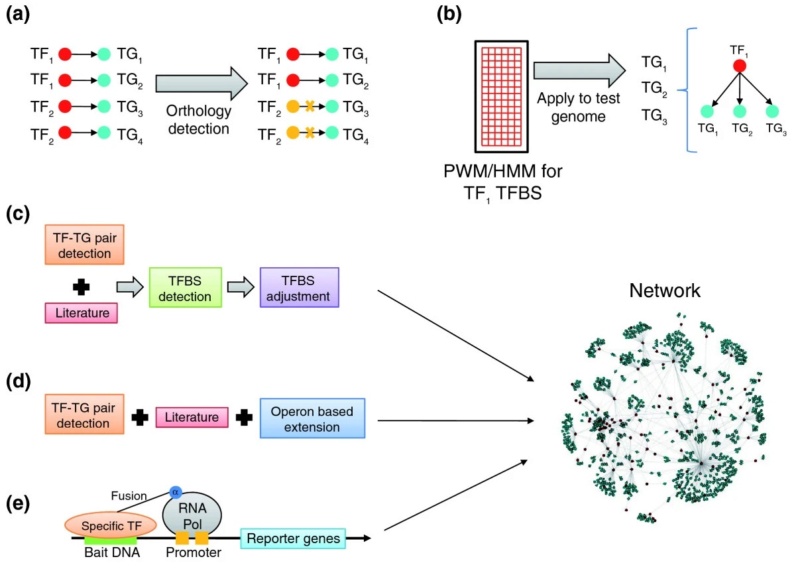
Methods of network inference in uncharacterized prokaryotes.
(a, b) Conventionally used methods for network reconstruction. (a) Orthology detection by comparison of transcription factor-target (TF-TG) links between species. Crosses indicate links known from the first species that are not found in the second species. (b) Position-specific weight matrices (PWMs) or hidden Markov models (HMMs) derived from binding site alignments (represented here by a grid) are used to predict target genes for conserved transcription factors. (c, d, e) The three recently published approaches to network reconstruction discussed here. (c) The approach of Baumbach et al. (d) The approach of Balazsi et al. (e) The approach of Guo et al.. Refer to the text for details of each of the studies (c-e) aimed at reconstructing actinobacterial transcription regulatory networks. Pol, polymerase; TFBS, transcription factor binding site.
ANAÏS BROSSE (2018): Regulatory RNAs have emerged as important regulators of gene expression in all kingdoms of life, and many advances toward the understanding of their biology have been achieved in bacteria. Bacterial regulatory RNAs are often also referred to as small RNAs (sRNAs), as most of them range in size from 50 to 400 nucleotides. While it was recognized early on that these sRNAs can ensure extremely diverse biological functions, such as trans-translation (transfer-messenger RNA), ribonucleolytic activity (RNA moiety of the RNase P), or even involvement in protein secretion (4.5S RNA), the shared efforts of multiple groups in the last 2 decades have led to the identification of a plethora of sRNAs in virtually all bacteria. Many of these act as posttranscriptional regulators of gene expression and generally function by imperfectly base-pairing to target mRNA(s), leading to changes in their translation and/or stability. As more and more bacterial sRNAs are investigated in detail, it appears that regulatory events mediated by sRNAs are intimately intertwined with the previously characterized transcriptional bacterial network. First, the ability of sRNAs to act as regulators is mediated by the fact that their synthesis or activity somehow responds to the environment. In the very vast majority of cases, this is achieved by transcriptional control of sRNA synthesis, mediated by transcription regulator proteins (TRs) ( General transcription factors are a small group of highly abundant proteins that assemble on the promoters of all genes transcribed by RNA polymerase II, whereas thousands of different low abundant proteins are gene regulatory TFs. ). The second characteristic that makes sRNAs important actors of regulatory networks is that they target multiple genes involved in all kinds of cellular functions, including genes for TRs, possibly creating a feedback circuit (i.e., the sRNA regulates expression of its own transcriptional regulators TR). Thus, the expression of many bacterial genes is in fact controlled by mixed regulatory networks combining transcriptional and posttranscriptional regulatory steps mediated by proteins and sRNAs, respectively. Different cases have been reported where transcriptional and posttranscriptional controls can occur independently, or rather “in cascade”. 5
Cristian M. Pis Diez (2022): The different niches through which bacteria move during their life cycle require a fast response to the many environmental queues they encounter. The sensing of these stimuli and their correct response is driven primarily by transcriptional regulators. This kind of protein is involved in sensing a wide array of chemical species, a process that ultimately leads to the regulation of gene transcription. The allosteric-coupling mechanism of sensing and regulation is a central aspect of biological systems. Bacteria have colonized essentially every type of niche, regardless of how harsh a particular environment might be. A single bacterium often moves through several niches during its life cycle; thus, a rapid response to the environmental changes and presence of stressor molecules is critical. For this to occur, bacteria must correctly sense and transduce various environmental signals by using complex signaling pathways that ultimately lead to the transcription of specific genes required for survival in each situation. This response is orchestrated by transcriptional regulators (TRs) that can function as single component systems, as DNA-binding proteins with the ability to modulate function as a response to the presence of some specific chemical species, or as part of a more complex signaling pathway. Recently, structural details of small molecule and metal ion sensing riboswitches have also appeared, making it clear that both protein and RNA have the level of specificity necessary to regulate transcription outcomes in response to small molecules. Generally, TRs have two domains or motifs—one that harnesses the residues involved in the specific interactions with the operator region of the DNA (namely, DNA-binding domain or site) and another one that is involved in inducer recognition (namely, regulatory domain or site). With some TRs, the regulatory domain might have more tasks beyond the modulation of the DNA-binding affinity, including ligand binding, protein–protein interaction, and enzymatic activity. TRs can act as repressors or activators. Generally, the transcriptional repressor bound to DNA represses transcription by blocking the activity of RNA polymerase, and in the presence of the inducer, the TR dissociates from DNA and initiates transcription. On the contrary, transcriptional activators enhance transcription by binding to DNA, for example, by recruiting RNA polymerase for the activation of gene transcription. The process by which the binding event at the regulatory domain influences DNA binding at the DNA-binding domain, and thus, the regulation over gene expression, is termed allostery. Allostery consists of a fundamental thermodynamic phenomenon in which the binding of one ligand influences the binding of a second ligand or activity at a physically distinct site. Allosteric communication between two ligand-binding sites in a protein is a central aspect of biological regulation. The structural biology revolution experienced during the last two decades has served not only to provide invaluable experimental and predicted structural details of various states of proteins and nucleotide complexes but has also made clear that proteins exist as dynamic conformational ensembles, interconverting between different conformations with varying energies. This distribution of ensembles is not static, as the populations shift upon the formation of a covalent bond, noncovalent binding, temperature changes, or other phenomena. The population shift is a consequence of a change in the relative stabilities of the conformations and is indeed the origin of the allosteric effect. In these ensemble models of protein function, allostery can be considered a change in the affinity for a ligand by the shift in the accessible conformations upon another ligand binding at a different location in the macromolecule rather than a structural change between two static conformations.
TRs are classified in protein families based on sequence similarities, particularly in the DNA-binding region. Moreover, members of the same family are characterized by a certain degree of conservation in the overall molecular architecture and structural motifs. The chemical species eliciting a transcriptional response may be metal ions, metalloids, small organic molecules, or even lipids. 6
A.Martínez-Antonio (2008): In bacteria, coupling of gene expression with external conditions is achieved through two molecular functions:
- recognition of a relevant effector signal or metabolite.
- binding of transcription factors (TFs) at specific sites in the genome and
Typically, these functions are performed by different domains of a single polypeptide, but there are also cases where two interacting proteins are responsible for these functions, as in two-component systems. At the phenotypic level, there are evidences for the coexistence of multiple phenotypes in bacterial cultures, e.g., of cells with different morphological and physiological abilities such as motility, biofilm formation, drug resistance, etc. In particular, biofilm formation and chemotaxis are considered as multistage developmental processes, and in mature biofilms, a mixture of bacterial population from different developmental stages were found to coexist. Available experimental data point to more than 3000 regulatory interactions between TFs and their regulated genes in E. coli.
Global analyses of this huge network have already been published, emphasizing a hierarchical organization and statistically over-represented regulatory motifs. The E. coli transcriptional cross-regulatory network encompasses 115 TFs and 7 sigma factors, i.e., around one-third of the total predicted TF proteins in this bacterium (Fig. 1)

Fig. 1. Core transcriptional regulatory network of E. coli.
Blue and pink nodes represent genes encoding for TFs and sigma factors, respectively; each node label is accompanied with its connectivity showing the number of regulatory targets. Edges represent cross-regulatory interactions (green for activation, red for repression, blue for dual interactions and yellow for sigma transcription), whereas loops represent transcriptional autoregulations. Specific subnetworks, such as the one associated with the regulation of carbon sources, are delineated with dashed lines to distinguish different regulatory modules.
On average, every TF is connected to two other TFs. However, the connectivity distribution of TFs is not uniform, with a small fraction of global TFs with high out-degrees dominating the network. Seven global regulators were defined previously based on a collection of criteria:
(i) number of regulated genes;
(ii) number of regulated genes encoding for TFs;
(iii) propensity of cooperative regulation of targets with the aid of other TFs;
(iv) ability to directly affect the expression of a variety of promoters that use different sigma factors;
(v) belonging to evolutionary families with few paralogs; and
(vi) heterogeneity of the functional classes of the regulated genes.
In order to better visualize the information flow through the network, the following graphical conventions have been used in Fig. 1:
(i) the size of the nodes representing TFs is proportional to the number of genes they regulate [e.g., cAMP receptor protein (CRP) regulates 413 genes and is represented by the second biggest node, after the housekeeping sigma factor rpoD]; (ii) arrows and colours refer to the direction and sign of the regulatory interaction;
(iii) arrow thickness is proportional to the impact of the interaction, computed the number of genes thereby (in)directly regulated.
The majority of the TFs in this network are auto-regulated (~70%), of which about two-thirds account for negative loops. The dominance of positive regulatory interactions in the regulatory network of E. coli is not limited to those among TFs, as when we compute the regulation of all the target genes (3017 arcs) we found that about 54% (1630) are positively regulated, 40% (1206) are repressed, while about 6% are dual regulated. This is especially interesting because a majority of the TFs in bacteria have been reported to act as repressors. The conventions used in Fig. 1 clearly display the hierarchical organization of the network, with master regulators such as CRP, fumarate and nitrate regulatory protein (FNR) or integration host factor (IHF) each (in)directly regulating a large number of other TFs. Furthermore, the layout emphasizes important variations regarding the length of the transcriptional cascades. Although functional annotations on TFs are still limited, it is possible to classify the cross-regulating TFs into broad categories according to the physiological functions of the target structural genes: carbo-hydrate initial catabolism, respiration, biofilm formation and chemotaxis, etc. As shown in Fig. 1, these broad classes correspond to different local network topologies. Due to their contrasting topologies, in what follows, we will focus our discussion on short regulatory cascades observed in the case of carbohydrate catabolism as opposed to long regulatory cascades seen in the case of biofilm and chemotaxis pathways. CRP resides at the top of both subnetworks. CRP is the only global TF acting hierarchically over local TFs for the usage of carbohydrates, whereas CRP's activity is comparable to the activity of other global regulators in the rest of the network. Note that the concentration of its effector metabolite, cyclic adenosine monophosphate (cAMP), is at par with that of adenosine triphosphate (ATP), which acts as the energetic currency of the cell. This suggests that CRP not only regulates the use of these substrates for producing ATP, but also senses the energetic status of the cell to decide the execution of other cellular programs. This study aims at understanding the network structure in relation to physiological roles played by the different modules, focusing on differences in the topologies of the subnetworks controlling metabolism versus motility and chemotaxis. However, other subnetworks are also worth mentioning. In particular, all nine TFs controlling the expression of genes for amino acid biosynthesis seem to be expressed constitutively by sigma 70. Each TF regulates the transcription of the required genes for producing different amino acids. The regulatory logic in this complex subnetwork is peculiar, as their components form multi-element circuits.
Multiple parallel feed-forward loops regulate the use of different carbon sources
Cellular feeding, which includes the uptake of carbon and energy sources and their metabolism, can be considered as one of the main physiological processes in bacterial systems. The regulation of these processes directly affects cellular fitness. The selection of carbon sources is regulated by CRP and about 20 more specific TFs (Fig. 2a).

fig. 2. Functional organization of E. coli core transcriptional network.
(a) selection of carbon source (group A), global regulation (group B), and regulation of developmental processes (biofilm and chemotaxis, group C). (b) Average mRNA levels per cell for each TF group defined in (a), together with standard deviations. Levels of mRNA were recovered for 13 TFs (56%) of members of group A, all TFs of group B, and 13 TFs (54%) of group C. Nodes in light blue represent members of two-component systems.
The hierarchical organization of the corresponding subnetwork is characterized by a short average path length. Regulatory interactions between CRP and the specific TFs result in the occurrence of multiple feed-forward loops (FFLs) for the use of alternative sugar sources. FFL is a network motif recurrently found in transcriptional networks and is defined as a three-gene pattern composed of two input TFs, one of which regulates the other, both jointly regulating a target gene. Based on the mode of regulation of each TF, this motif is subdivided into eight different subtypes. Coherent FFL type 1 corresponds to all the regulatory interactions in the motif being positive; in incoherent type 1 FFL, the first TF regulates positively both the targets, although the second TF represses the expression of the target gene thereby reversing the final effect. The majority of the FFLs present in the subnetwork for carbon catabolism belong to concentrations of the amino acids, allosteric modifications of TFs follow binding to their respective amino acids, resulting in TF autorepression as well as to the repression of the corresponding biosynthetic genes. Interestingly, the logic behind negative autoregulation, in this case, is different from that of the catabolism of carbohydrates. While in the latter case TFs are autorepressed until the substrate is available, in the case of amino acids, TFs are auto-repressed only in the presence of an excess of the coherent and incoherent type 1 groups, with both TFs working together, as a result of a persistent signal affecting the global TF (in this case, cAMP) and the presence of a signal affecting a TF corresponding to a sugar alternative to glucose. This motif structure enables the filtering of short pulses of the signal affecting the global TF (cAMP) in case of transient glucose deprivation. Consequently, the target structural genes are activated only in the persistent absence of glucose and in the presence of an alternative carbon source. The phosphotransferase system typically transports and phosphorylates certain sugars, including glucose, a preferred carbon source for E. coli, and this condition ultimately results in low levels of cAMP. Consequently, CRP does not activate the transcription of the genes responsible for the degradation of alternative sugars. Note that most structural genes involved in the transport and initial catabolism of alternative carbon sources are encoded in operons, each specifically repressed in the absence of the inducing sugar. When glucose is lacking, cAMP level increases and CRP can activate the transcription of genes responsible for degrading alternative carbon sources. Simultaneously, sugars (or a processed variant thereof) present in the cell bind their specific TF; allosteric interactions then result in TF unbinding from DNA, alleviating the repression and permitting the transcription of the corresponding target genes. This organisation involving multiple parallel FFLs coupled to phosphotransferase activity appears optimal for enabling rapid transcriptional responses to sudden lack of glucose in the presence of alternative carbon sources in the milieu. 12
1. Marc S. Halfon: Perspectives on Gene Regulatory Network Evolution 2017 May 18
2. Lesley T. MacNeil: Gene regulatory networks and the role of robustness and stochasticity in the control of gene expression 2011 May; 21
3. Julio Augusto Freyre-Gonzalez: Analyzing Regulatory Networks in Bacteria 2014
4. Agustino Martinez-Antonio Identifying global regulators in transcriptional regulatory networks in bacteria October 2003
5. Anaïs Brosse: Bacterial Small RNAs in Mixed Regulatory Networks 2018 May;6
6. Cristian M. Pis Diez: Bacterial Transcriptional Regulators: A Road Map for Functional, Structural, and Biophysical Characterization : 16 February 2022
7. L. Aravind: Reconstructing prokaryotic transcriptional regulatory networks: lessons from actinobacteria 15 April 2009
8. Albert-László Barabási: Network biology: understanding the cell's functional organization FEBRUARY 2004
9. Michael E. Wall: Design of gene circuits: lessons from bacteria 01 January 2004
10. Liu Tian et al. The Spatial Organization of Bacterial Transcriptional Regulatory Networks July 20, 2022
11. Edda Klipp et.al. Systems Biology A Textbook 2016
12. Agustino Martínez-Antonio: Functional organisation of Escherichia coli transcriptional regulatory network 2008 Aug 1
Last edited by Otangelo on Wed Sep 07, 2022 8:36 am; edited 2 times in total


